Research Highlight: Evaluation of packaging for sponsor's products thru ISTA and ASTM testing standards

A major specialty packaging company producing multilayer beverage packaging recently sponsored this undergraduate packaging engineering project. It came to the sponsor’s attention that their packaging was not holding up well to the parcel distribution process; their customers were reporting leaks and other damages upon product arrival. The current testing that the company had been running on their products were the ISTA standards 3A and 6A, but they’ve determined that these test methods do not replicate the levels of damage found in their real shipments.
Damage caused by handling and sorting packaged goods is inevitable during distribution. Before reaching the customer, the package is subjected to a number of risks as it travels through the supply chain, including drops, impacts, crushing forces, vibration, climatic and pressure changes. If the product arrives damaged, all of the manufacturing, engineering, and quality efforts were in vain. Numerous factors can cause a product to be damaged during distribution and handling. In the context of shipping small parcels, shock is one of the more severe and prevalent dangers. The goal of this project was to address this issue; determine where in the shipping process these “risks” are occurring and at what volume, so the packaging can be altered in such a way that the product won’t experience as much damage.
Over the past two decades, research around the events that happen to packages during transportation has consistently grown. Majority of the products being transported today are sold via e-commerce, and this ends up lengthening the overall transportation and shipping process. Ultimately, this may cause more damage to products as their packaging was not designed to withstand extended transportation. With such demand in this field, it is vital that more accurate testing standards and improved packaging are found.
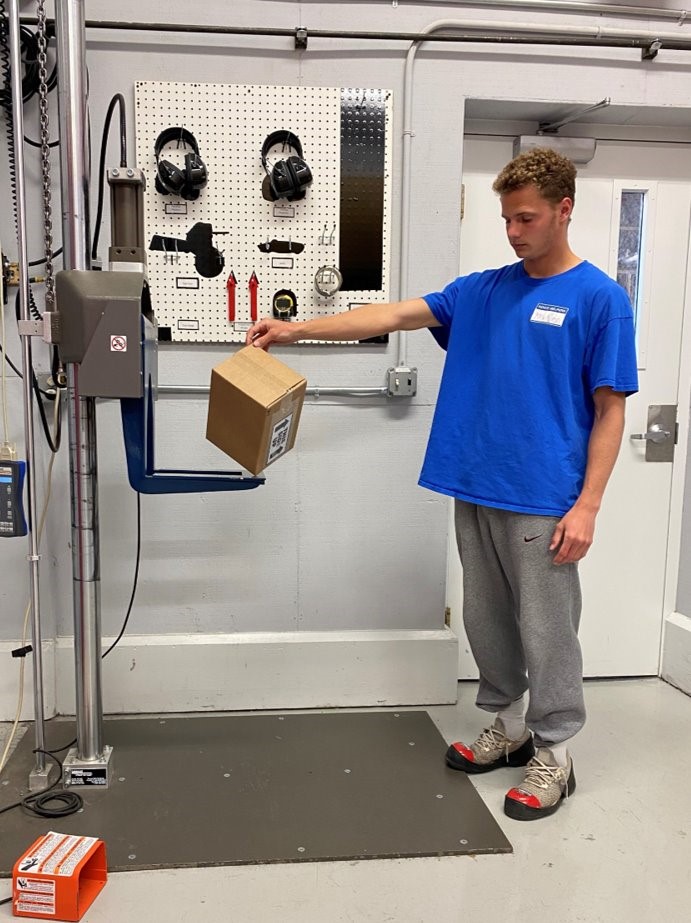
For this project, eight decoy boxes were created reflecting the correct dimensions and weight of packages that the sponsor ships regularly. Once these decoy boxes were made, sensors (Image 2) were placed in the decoy boxes, they were calibrated, and then shipped back-and-forth to Texas. During the calibration process, the decoys with the sensors were dropped from various known heights (Image 1), and the resulting G forces were recorded. This was a crucial step as the ISTA standards are written in terms of drop heights; whereas, most packages won’t actually face any sort of harsh drops, but rather other types of impacts. Calibration is the conversion from the standards to real life impacts. The sensors kept track of which face, edge, or corner of the package the impact occurred to, the date and time of each impact, and the level of the impact that occurred.


Using the data collected from all of the decoy boxes, this project analyzed and determined where in the shipping process the damages are most likely occurring and how much force caused said damage. From there, the laboratory tests for the packages can be altered to better reflect the actual shipping process.
Based on the field data, the majority of the shocks and drops occur on the bottom half of parcels. Interestingly, the shape of the packages has an effect on the frequency of shocks and drops. The package that was squarer than the others experienced less frequent shocks compared to the rectangular packages. Additionally, differences were observed between the three investigated couriers.
The results of this project were calculated and shown through data charts. There was a lot of data to be observed and analyzed between conducting calibrations and the shipment processes. Based on our results, the courier, the shape of the box, and how it is shipped all affect the number of drops, drop height, and orientation of drops it experiences.
The results revealed that at the 95% level the packages experienced 20 drops per trip which is more than the 17 drops required by the ISTA 6A. Also, 95% of the drops experienced by the packages were below 30 in. which is lower than the 36 in. maximum drop height required by ISTA 6A. The drop orientations discovered are shown in Figure 1. The four investigated packages sizes did not experience significantly different shock environments. Nor did any of the markings on the package affect the handling nor the magnitude or number of drops experienced by the packages (Image 3).

However, different couriers do have different effects on the shipping process (Table 1). The three different couriers tested, FedEx, USPS, and UPS, have different processes such as sort centers, routes taken, and number of stops until the package has reached its destination. FedEx has an average of five stops, but UPS averages six stops before each package reaches its endpoint. This could also explain why the USPS has higher drop height average because the packages that are shipped through USPS experience more handling. This could also explain why the USPS has a higher coefficient of variation because of there being more opportunities for drops to occur. The difference in couriers influences the shock intensities as well.


